Edit: I did not make the cartograms shown below. I found them on the
site of Mark Newman from the Univ. of Michigan Physics Dept. His site has had 500,000 hits this week, and he included an FAQ, as well as a link to the free software he used to make these. If I get any data, maybe I'll try to make that education map that Darius mentioned. I've been curious about that variable as well.
View Larger MapThe only 3 precincts in Franklin County
Electoral College above
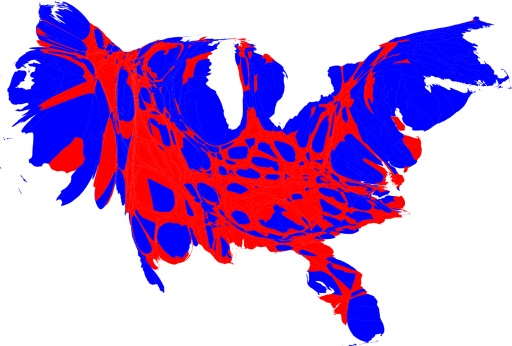
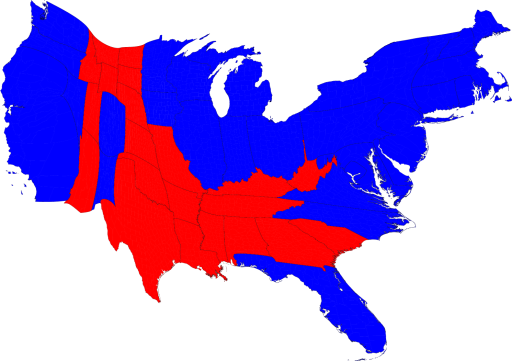
by County

2004 Popular Vote

2 comments:
Funny, election night I was thinking how poorly the conventional USA map with red and blue states reflected the popular vote by population and even more so the electoral college tally.
Geographically, much of the country was red; but for the most part they were states with low populations and delegate counts.
These cartographs are my more precise. You can look at a state's size relative to its neighbors and get an idea of its weighted importance.
You should get these to CNN and the like for next time.
I would like to see the by county one with a major metropolitan name tag overlay.
Also, one with an educational achievement or national rank overaly.
Post a Comment